Sectoral Distribution Of Bursa's Export |
| 31.12.2024 Yearly Export Performance of Sectors (1000 $) |
| SECTOR |
2023 |
2024 |
Change(%) |
| Steel |
952.110,67 |
1.012.951,91 |
6,4% |
| Cement Glass Ceramics and Products of the Soil |
45.646,23 |
46.818,86 |
2,6% |
| Iron and Nonferrous Metals |
630.928,53 |
598.965,98 |
-5,1% |
| Leather and Leather Goods |
51.955,97 |
52.347,15 |
0,8% |
| Electric, Electronic and Service |
217.329,15 |
235.060,31 |
8,2% |
| Nut and Products |
16,7171 |
24,10 |
44,2% |
| Vessel and Yacht |
97.621,55 |
90.474,96 |
-7,3% |
| Carpet |
19.289,42 |
17.936,67 |
-7,0% |
| Ready to Wear and Apparel |
1.544.274,51 |
1.574.928,90 |
2,0% |
| Grain, Pulse, Oil Seeds and Products |
99.798,51 |
116.736,97 |
17,0% |
| Air Conditioning Industry |
529.277,18 |
538.481,25 |
1,7% |
| Chemicals and Products |
695.936,41 |
861.848,95 |
23,8% |
| Dried Fruit and Products |
2.582,44 |
2.593,51 |
0,4% |
| Mining Products |
124.548,95 |
94.737,57 |
-23,9% |
| Machinery and Parts |
1.391.909,12 |
1.258.106,53 |
-9,6% |
| Fruit and Vegetable Products |
180.684,07 |
203.366,75 |
12,6% |
| Furniture, Paper and Forestry Products |
854.572,70 |
777.960,79 |
-9,0% |
| Jewellery |
1.660,44 |
1.050,82 |
-36,7% |
| Automotive Industry |
7.203.334,86 |
7.654.711,99 |
6,3% |
| Aquaculture and Animal Products |
142.639,5337 |
152.110,76 |
6,6% |
| Ornament Plant and Products |
6.675,32 |
6.908,83 |
3,5% |
| Textile and Raw Materials |
1.259.898,68 |
1.283.893,48 |
1,9% |
| Fresh Fruits and Vegetables |
81.679,10 |
76.702,75 |
-6,1% |
| Olive and Olive oil |
33.458,02375 |
43.484,34 |
30,0% |
| Unknown |
2.468,60 |
3.659,64 |
48,2% |
| Export Differential exempted from registration of Exporters' Associations |
1.477.114,71 |
1.481.208,03 |
0,3% |
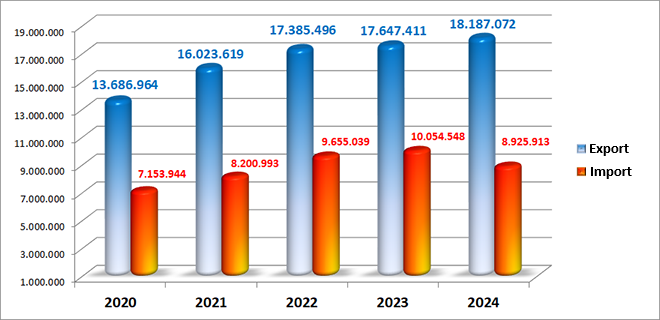
| Toplam |
17.647.411,40 |
18.187.071,81 |
3,1% |
|